A Tale of Two Regions (the Bay Area and New York)

By Ella Foster-Molina and Leslie Foster

This is a story of the value of shelter in place. It’s not conclusive yet. As we move through this crisis we’ll gain evidence and update this story.

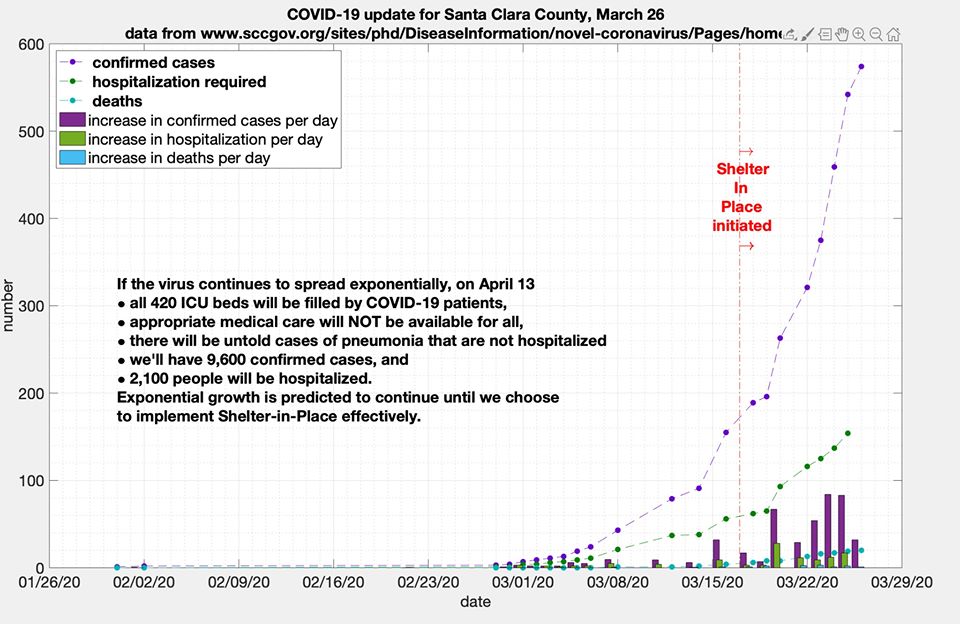
On March 17, 2020 Santa Clara County had 86 confirmed cases per million residents. New York State had 85 per million. Santa Clara implemented shelter in place that day. New York State waited 5 more days. In that time, they gained an extra 675 infected people per million. Many of those 675 people per million, and all the people they had infected, had been wandering around New York State for 5 days without restriction.

It’s been 11 days since shelter in place was ordered in Santa Clara County. Initial indications from total cases are promising, but are too strongly influenced by testing capacity to be fully reliable. Hospitalizations are a much more reliable number, but it takes approximately 2 weeks to go from infection to hospitalization.* We hope to see an effect starting March 31st for Santa Clara County. 

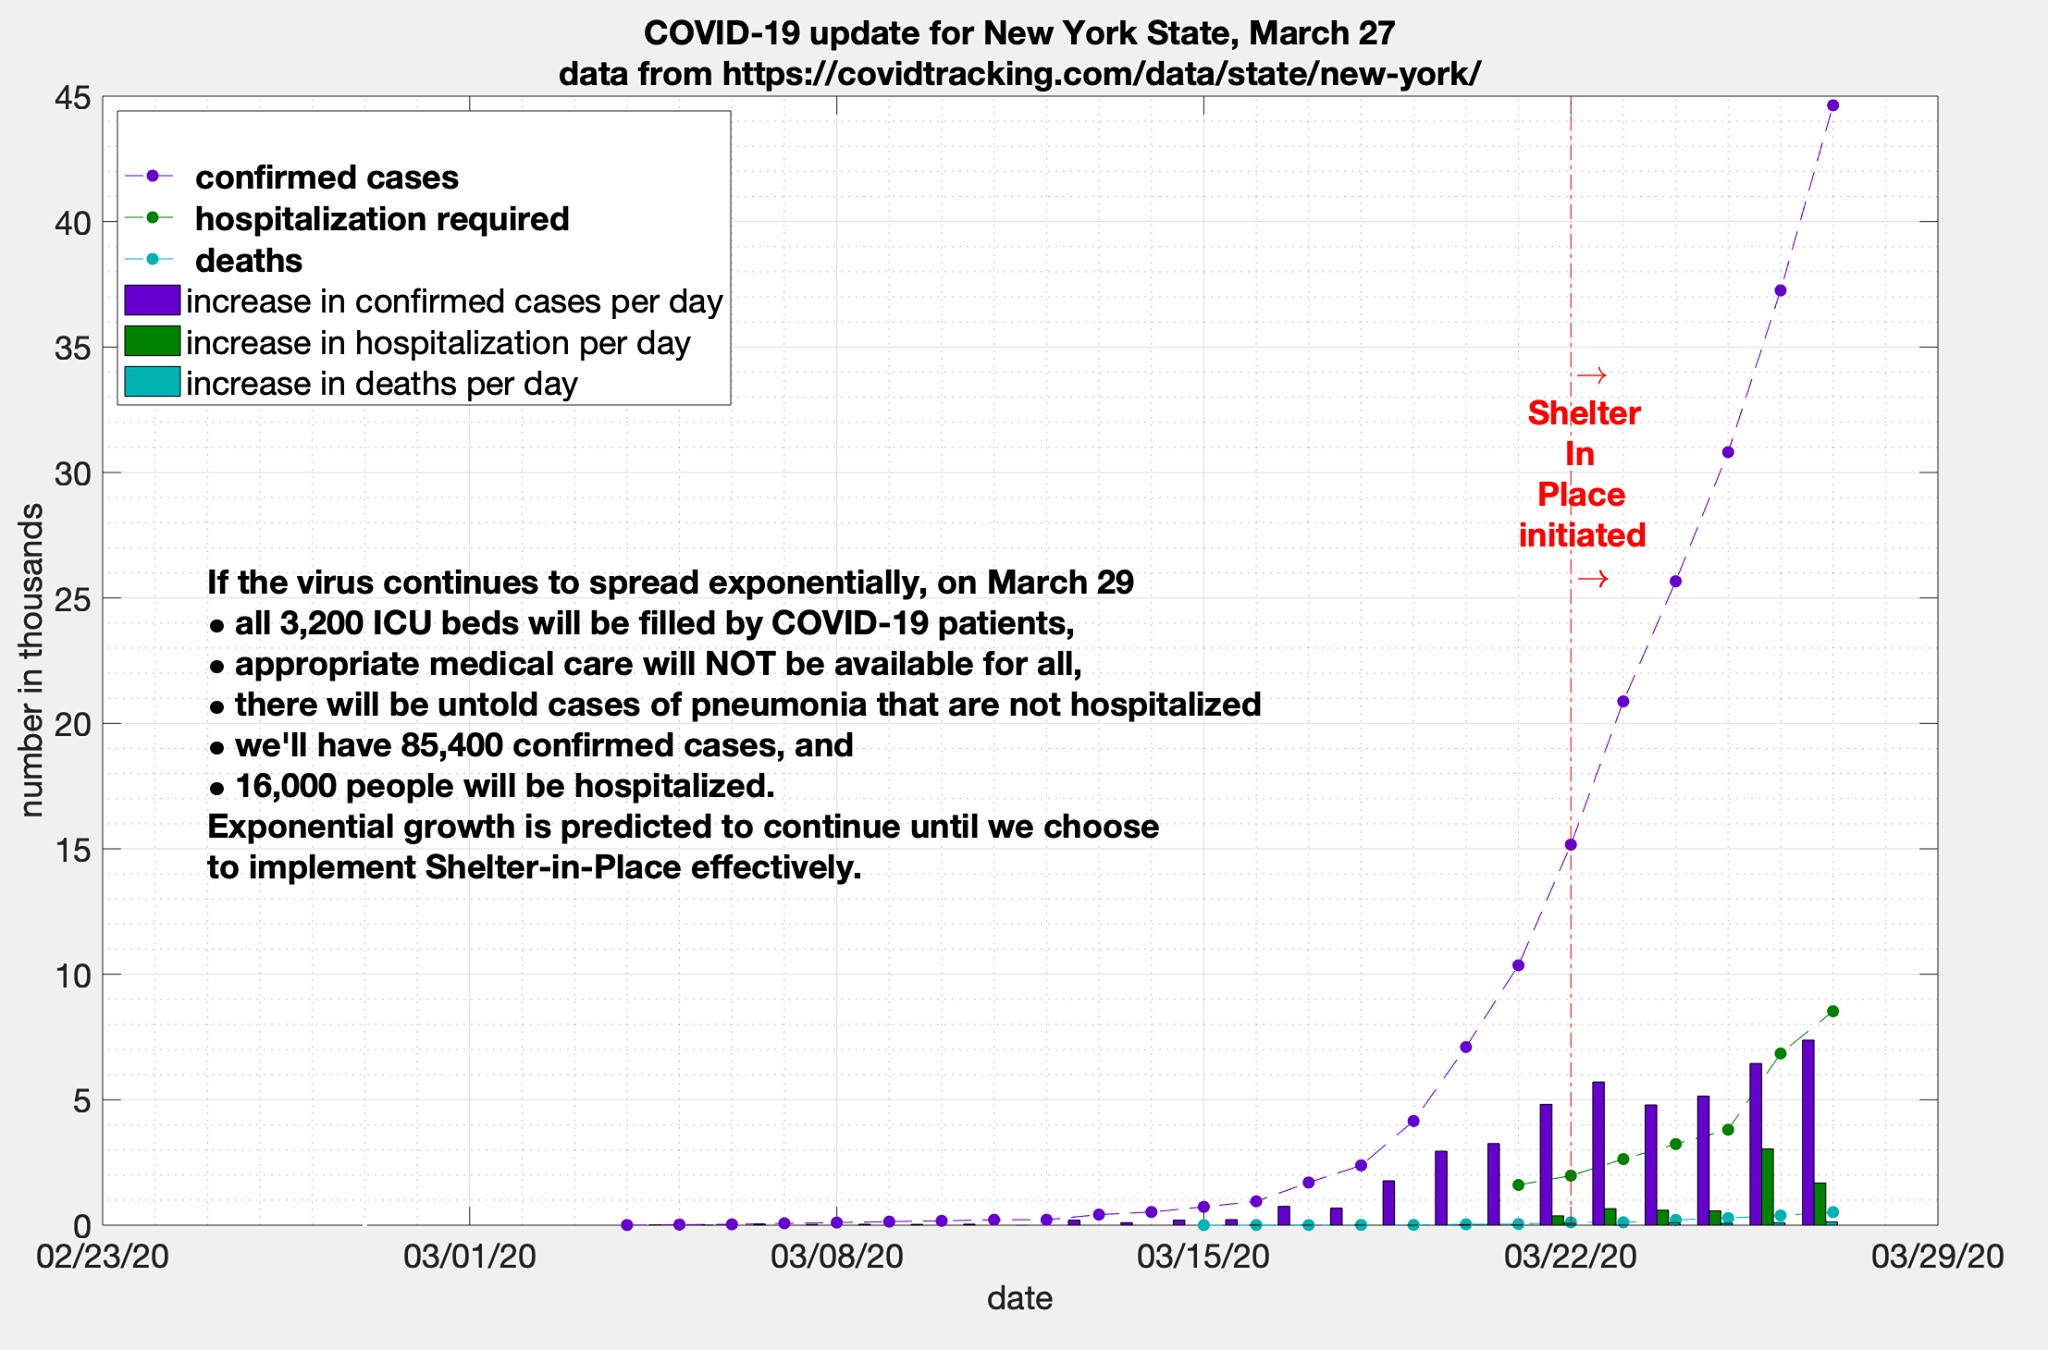
If we have not obeyed shelter-in-place orders well enough, this is what will happen.** Santa Clara County has about 420 ICU beds. If the curve hasn’t bent by April 13, we estimate that all ICU beds will be full and appropriate medical care will no longer be available to the general public. At that point, we expect there to be 2,100 hospitalizations from COVID-19, 260 dead, and untold more asked to stay at home with COVID-19 induced pneumonia that isn’t severe enough to warrant hospital treatment.
New York will suffer more, and can’t hope to see the curve bend in response to shelter-in-place rules before April 4th. Today, March 28, 728 people died in New York. Tomorrow, well before any improvements could have been expected from shelter-in-place, we expect all of the roughly 3,200 existing ICU beds to be filled by COVID-19 patients. In addition, the current trends project 16,000 people will be hospitalized. We hope that shelter-in-place bends the hospitalization in New York State starting April 4th, and that the death rate starts bending April 16th.
The more thoroughly we all

  • obey social distancing measures, 
  • allow close contact only within a safe bubble of trusted household members who solely interact with each other outside of essential activities,
  • wash our hands,
  • and wear masks,

 the more quickly we’ll bend the curve.

If we do it well enough, we’ll have few enough new cases that we can track them and those they may have exposed. If we do it well enough, we could resume a cautious, limited version of our lives without accidentally spreading or catching a deadly virus. If we do it well enough, we can mostly get lives back until our scientists uncover a vaccine.

* The effect on deaths in Santa Clara County should begin April 12, because it takes estimated 25 days from infection to death on average.

**Note that some of the data used (e.g. the number of ICU beds needed) are estimates. The mathematical models are approximations of the actual virus trajectories.

Posted in Uncategorized | Leave a comment

Teaching Online During the COVID Crisis

If you’re here for resources on teaching online during the COVID-19 crisis, click here, or go directly to one of the following resources:

Posted in Uncategorized | Leave a comment

Visualizing Increased Trump Support

Visualizing the relationship between county level income, education, and how much more voters voted for Trump (2016) than they voted for Romney (2012)

Adding in increase in deaths from drug overdoses between 1980 and 2014, but removing the regression plane.

Posted in Uncategorized | Leave a comment

Welcome!

I am developing the Social Sciences Quantitative Laboratory (SSQL) at Swarthmore College. The laboratory seeks to increase quantitative skills for social sciences students already involved in quantitative learning and to entice students unfamiliar with quantitative methods to dive in. It offers quantitative support to students in Economics, Political Science, and Sociology/Anthropology through workshops offered twice per week, one-on-one consulting, and developing curricula with faculty members. The first two years have been a substantial success. The SSQL has reached 485 students through workshops as well as individual meetings regarding research projects, programming, and homework. I am collaborating with 4 faculty members at three liberal arts colleges to design and teach an online introductory data science course in the summer of 2019.

I did my graduate work in political science at the University of Rochester, and hold a B.A. in mathematics and political science from Swarthmore College. I have taught at Georgetown, University of Rochester, and SUNY Oswego. My classes cover a broad range from data analysis to game theory to American Politics.

My research explores the connections between inequality, representation, and institutions in American politics. Using novel datasets compiled from Twitter, the Congressional staffing, and four decades of legislative activity in the House of Representatives, I examine how members of Congress allocate their time and money based on the socioeconomic characteristics of their districts. I extend this work to the effect of campaign donations on elections results, using novel data from a randomized controlled trial being implemented by Measured Politics. Each of these areas of study involve complex correlations between important explanatory variables. To better understand how income, education, race, and more affect political outcomes, I am developing a method, Directional Regression Analysis. This method improves the precision of estimates for highly correlated explanatory variables in multivariate regressions. It also provides a novel interpretation of multicollinearity, confounding variables, omitted variables, and instrumental variables.

Please feel free to contact me at ella.fostermolina+WP at gmail dot com with any questions about me or my work.

Posted in Uncategorized | Leave a comment

Quick Links to Explore Data Analysis Skills

As I have developed the Social Sciences Quantitative Laboratory, I built a list of free online tools that can be used to interact with, be amused by, and engage the theory behind data. This post summarizes some of these resources.

Theory Development 

Theory development is the core of any data analysis project. It informs the questions we ask, the data we use to answer the questions, how we understand discrepancies in our data, when the evidence is sufficient to answer the question, and much more. Two resources I’ve found useful for explaining the importance of theory development are:

Spurious correlations: While the primary point of this site is to amuse the reader, it can also be used to explain the need for a strong theory. Many correlations arise by accident. Theory informs what correlations we think will be relevant. I ask students to work in group to discuss one correlation of their choosing. The task it to explain (1) why the correlation is spurious and (2) to come up with a theory that could explain the correlation. The goal is to engage the students in creative thinking, as that is the core of theory development. It also emphasizes that humans can come up with a theory for just about anything, so we need to be careful about defining our theories before we analyze our data. Otherwise, we’ll come up with ad-hoc explanations for everything we see instead of rigorously testing our ideas.

Correlation is not causation: XKCD is an amusing webcomic with has a strong scientific grounding. I use it regularly to add dimension to many data analysis concepts. I particularly like the hover-over text on this comic: “Correlation doesn’t imply causation, but it does waggle it’s eyebrows suggestively and gesture furtively while mouthing ‘look over there’.”

Regressions

Regressions are the workhorse of many social science studies. These are some links that help explain the core components of a regression, both to students with a background in statistics and to those who have never encountered a regression.

Manipulate scatterplots to see how the regression line changes: This interactive site allows the user to see how the regression lines change based on the distribution of data. It can be used to explain the impact of outliers, but also some principles behind least squares.

Extrapolating data: Another XKCD comic that cautions the users against extrapolating beyond the sample.

P-Hacking and Omitted Variable Bias

Interactive graphic with party control and economic power: The folk at fivethirtyeight.com do more than present statistical analysis of politics and sports. They developed an interactive, create-your-own-theory graphic that explains the phenomena of p-hacking. It can also be used to explain why omitting variables can influence the conclusions reached by data analysts. This goes along with an article that discusses scientific methodology.

The importance of effect size: In 2015 the World Health Organization classified cured meats as carcinogens. I use this tweet to highlight the importance of understanding the magnitude of the effect.

Jelly beans (don’t) cause acne: This is another XKCD comic. It shows that if you run an experiment on 20 different groups, then you expect to find a statistically significant results just due to random chance in one of those 20 groups. That is, in 1/20=0.05 groups, the results will be spurious.

Publication bias towards significant results: I use this XKCD comic to explain how journals accept articles with statistically significant results, and the language researchers use to try to accommodate that standard.

Data Visualization 

Visualizing climate change opinions

Beautiful graphs:

Misleading graphs:

Programming Skills

Two online resources provide a great introduction to programming skills. These are:

Both teach a variety of languages, including R, Python, and SQL. The courses are free and very well designed.

Here I switch focus from digital tools to teach data skills, to using human interaction to teach digital skills. Teaching digital skills is tricky, particularly when students are programming in real time.

  • Hire a student to serve as a debugger. Programming languages are notorious for creating idiosyncratic errors. One teacher cannot effectively keep up with all the bugs that come up, and students will be put off if their code breaks and can’t be fixed.
  • Emphasize good programming practices, including commenting, good variable names, and structuring code systematically. Many students will end up programming in a different language than the one you are teaching them. Teaching good programming practices will give them comfort in using new languages in the future.
  • Discuss the use of a full program, as opposed to piecemeal commands.
  • Explain the internal file structure of a computer.
  • Discuss the frustrations inherent in programming.
  • Help students learn how to find help, both online and using their network. Every programmer regularly asks for help on programming issues.

This list will be updated regularly.

Posted in Uncategorized | Leave a comment

Bills for the Rich, Bills for the Poor

I present these 8 visualizations without much comment. Each one represents the bill titles sponsored or enacted by the party and district wealth of the politician who sponsored it. The bigger the word, the more often it was included in bill titles.

Bubbles with only black words are the words that were common between the rich and poor districts. Green words are those bills that were most often used by poor districts, while orange words are those used by rich districts. The first four images describe all 6,000+ bills sponsored in Congress between 2013 and 2014. The last four images describe only those bills that successfully became laws, of which there were only a few hundred. Democrats were the minority party in this time period, so they not particularly successful.

Compare and contrast these bills. Politicians from poor districts talk more about land, politicians from rich districts talk more about ideas. What do you see?


word clouds


Posted in Uncategorized | Leave a comment

How to be better than Trump: Remember why you love our country

This is an optimistic essay. I believe every word of it. We have earned optimism and hope, and we need to remember why. Anyone can see the waves of fear encompassing our country, but there is no reason to let fear overshadow our better angels. I don’t believe we are perfect. I cry for our failings and then I listen to my better angels telling me to fix them. Because we all try to fix ourselves, I believe our country is one of the best world leaders we’ve ever seen.

Why do you love America?

I love America because we always try to make ourselves better. I love America because we are constantly trying to achieve our ideals: all people are created equal, should be treated as equal, and must be given every opportunity to thrive.

Don’t believe me? Do you have a picture of your great grandparents? Think about their lives. They likely faced polio and infant deaths and hunger and milk mixed with chalk and no electricity and a very basic reading ability. Here’s the crazy thing: they were doing better than their parents. Piece by piece, we are getting rid of disease and malnutrition and bad education. By our own ingenuity or God’s will, we are destroying the barriers that randomly extinguish a person’s ability to be the best they can be.

The United States has seen centuries of improvement. It’s not constant, and it’s not predetermined. We butt heads and argue because we care so much. It’s how we have always fought for improvement. We have to remember that sometimes progress slows, as it has for the past decade. But it hasn’t stopped, and we know we have the foundation to move forward again. 250 years of history tells us so.

We have improved: if you are liberal, you can point to same sex marriage, anti-miscegenation laws being a thing of the past, civil rights, improved education, improved health and so much more over the past 50 years.

We have improved: if you are conservative, you can point to our ingenuity exemplified in so many ways. We have improved transportation, a wealth of knowledge available to anyone with an internet connection, an improving business sector (don’t believe me? Go look it up), less violence, fewer murders, and a host of other technologies that improve our self reliance.

We’ve been so busy trying to fix ourselves, that we’ve forgotten to be proud of ourselves too. The second we forget why we are great, we tear ourselves apart and turn ourselves inside out trying to start from scratch or reverse our progress to a fabled better time. We don’t need to start from scratch or go backwards. We are better than we were. We still need change and we don’t need a strong man to do it for us. We need our strength, our voice, our will to change things. We’re a democracy. We can be great without Trump. We are great. We can find a leader who will listen to our struggles and our hopes; who will reflect our strength and desire to fix ourselves.

We don’t need radical change. We have a lot to be proud of. For every flaw you see, remember: our history tells us that we can and will make it better. We are strong. We are innovators.

“We hold these truths to be self-evident: that all (men and women) are created equal.” This is our history. This is our strength and who we are. Embrace it. Help us continue to make progress toward equal opportunity for all.

Why do you love America? Tell the world.

Posted in Uncategorized | 1 Comment

Dysfunctional government?

I’ve been going through a lot of legislative history recently. Occasionally, small facts stand out.

The first bill introduced to the 112th Congress was titled “Hurricane Sandy supplemental appropriations bill.” Only one person decided to put their name on this bill, a Representative Herald Rogers from Kentucky.

The second bill was named “Repealing the Job-Killing Health Care Law Act.” Not just one person decided to publicly support this bill: a full 182 members of Congress put their names on this bill.

Clearly, our country has gone bonkers. Horribly bonkers.

Until you take a second look.

The bill to provide aid to those harmed by the hurricane passed both the House and the Senate. Although this particular bill never became law, a closely related one, H.R. 152, was signed by Obama in the same month. Congress found a way to help people harmed by a natural disaster.

The bill to repeal Obamacare got lost in the Senate. Literally lost. Noone voted it down. The Senate just ignored it, like every other bill of its kind that our legislators use to proclaim their disdain for Obama.

The public was enthralled by this shiny activity around Obamacare. We were distracted by our dysfunction. Congress knew it too. The Republicans were playing for support from their conservative base. It’s worth taking a moment to consider how dysfunction satisfies the Republican base, but we should also pay attention to how policy changed. Because at the same time that Republicans were trumpeting discord, Congress was chugging away at making a real difference for the victims of Hurricane Sandy. It wasn’t perfect, to be sure, but it was a change in the right direction.

Lesson learned: sparkling activity, like lots of public support, doesn’t reveal the truth. At least for the first two bills of 2011, Congress got the policy right.


Posted in Uncategorized | Leave a comment

The history of party control in Congress

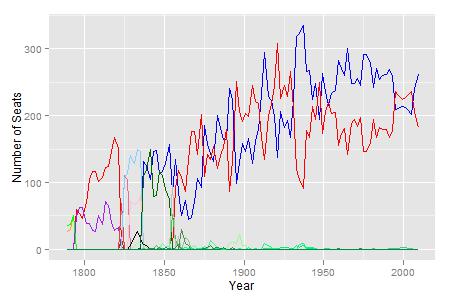
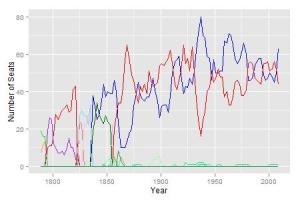
One of the big revelations I had as a high school student in the early 2000’s was that Democrats have almost exclusively controlled the House since the Great Depression, and have mostly controlled the Senate. This was not the impression popular media gave me, where the fluctuation in the president’s party and our “deeply divided country” took precedence over partisan control of Congress. This struck me a slightly absurd, because legislation and policy originate in Congress, not the presidency. Shouldn’t the originators of policy be at least as important than the administrative branch of government? Was there something else I was missing because I didn’t see the bigger picture?

Frustrated that I could not easily visualize the evolution of Congress and the presidency by party control over the entire history of our country, I looked for someone else who had done it. As amazing as the xkcd version is, the visual implies that the red/blue- Republican/Democrat- liberal/conservative split has persisted for all of our history. This is a fundamental misinterpretation of how parties and ideologies evolve. It’s not just that the partisan split has changed over time or that parties themselves have appeared and disappeared. The problem runs deeper. The fact is that the “liberal” and “conservative” perspectives from the 1840s would have been completely foreign to us today. So I grabbed some data from Keith Poole’s website , reorganized it by party control over time, and stuck into into some graphs color-coded by party. The results are shown below:

House of Representatives
housePartyProportionsGgplot

Senate
senatePartyProportionsGgplot

Legend
legend

Look at how many parties come and go for the first 75 or so years of government, and that doesn’t even account for the complete change in our form of government that occurred in 1889. For 13 years before the first Congress, we were governed by the Articles of Confederation. Some days I’m glad our parties are so stable today, and others I wonder if we should worry about stagnation caused by excessively sticky institutions that don’t adapt easily to changing social realities.

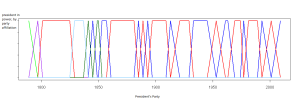
And because I was on a roll, I created a graphic for the party of the president throughout our history. It’s kind of fun that the less representative a chamber/office gets, the more fluctuation in party control we see.

President
presParty1

The graphs don’t show everything I want to know about party control of our government, but it’s a start.

Posted in Uncategorized | Leave a comment